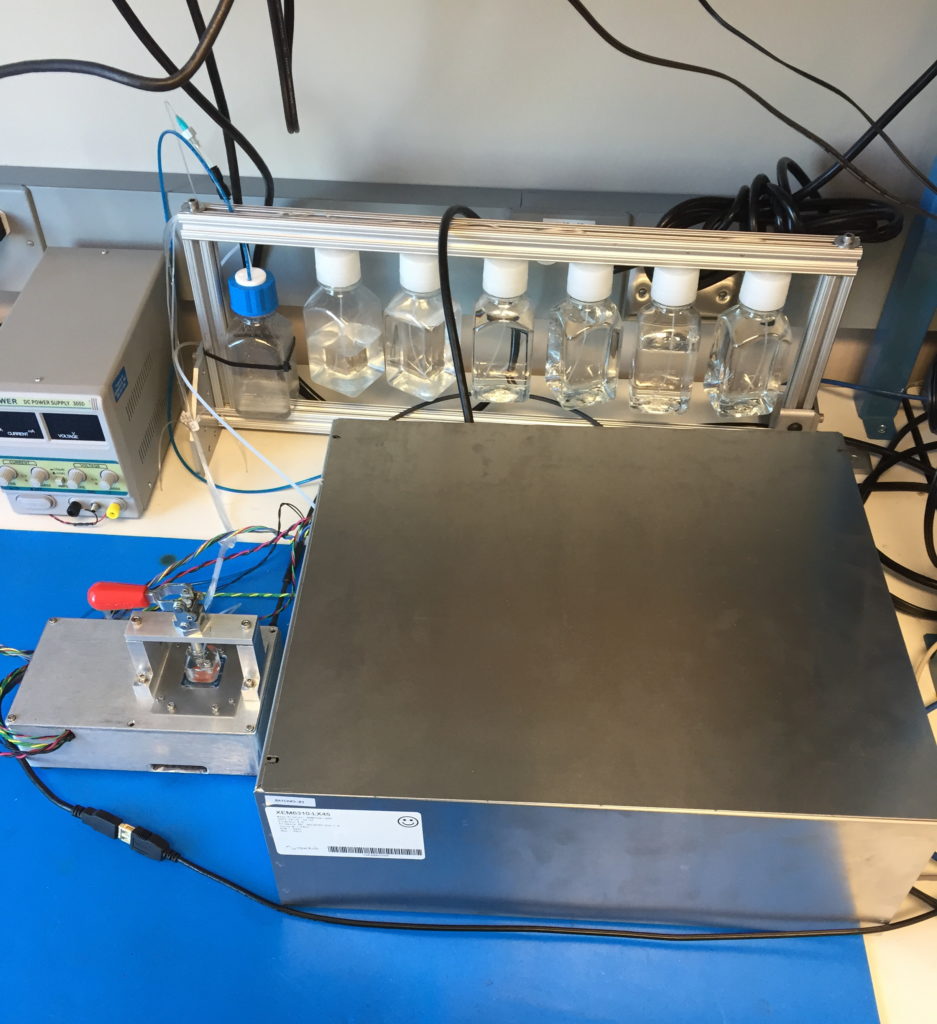
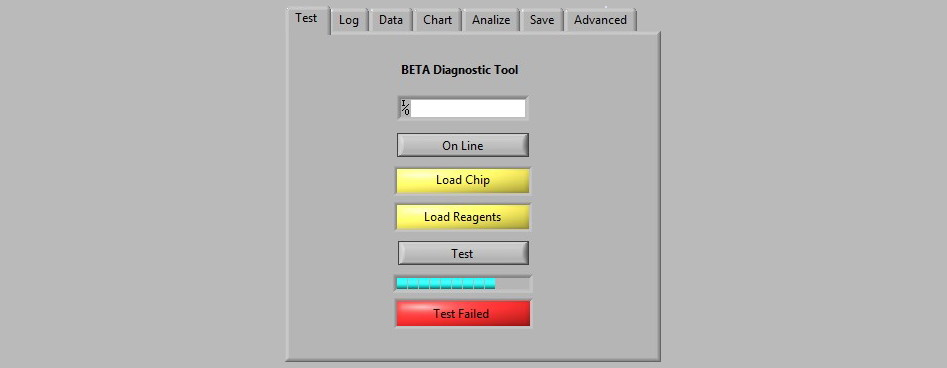
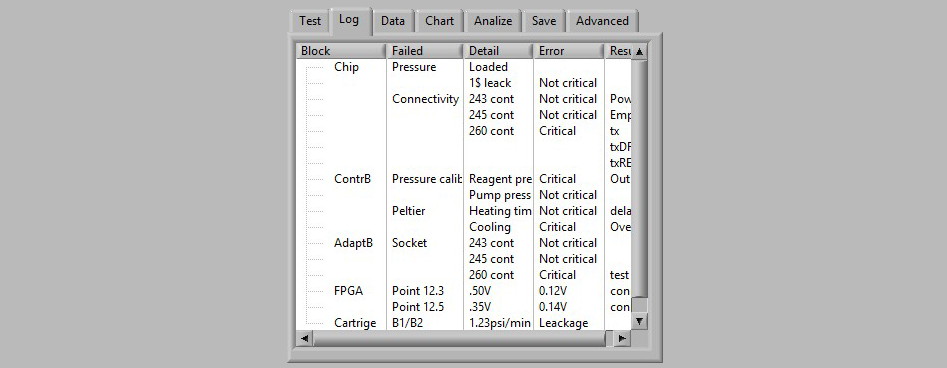
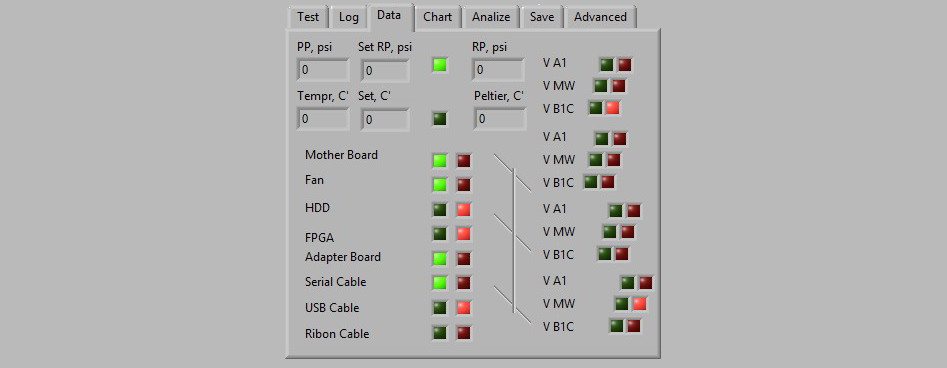
DNA Sequencer Instrument Test Bench. The Test Bench was designed to check the concept of BETA DNA Sequencer, components, software and impedance spectroscopy method as itself implemented to BETA instrument design. The result had admitted the insolvency of the method and the whole project
| Patents US5447841A 5,447,841 US6265171B1 US4666828A |
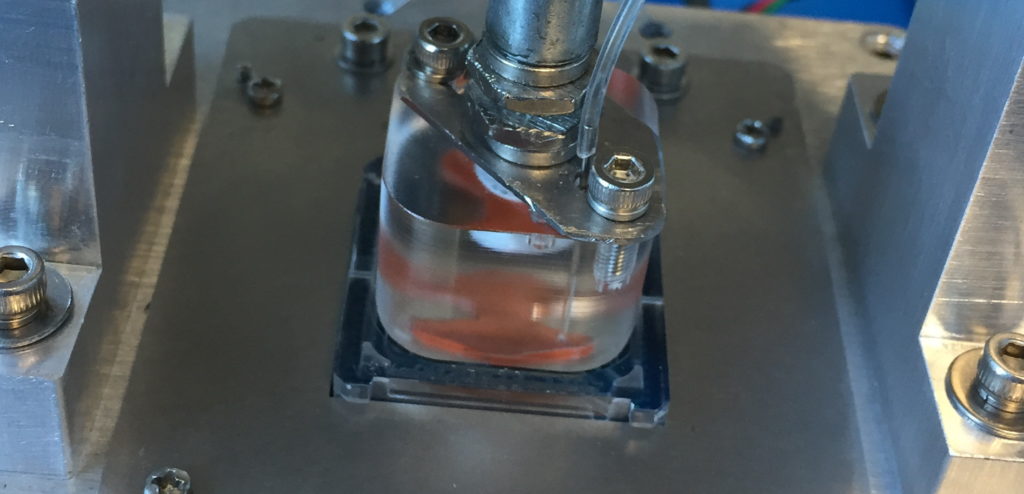
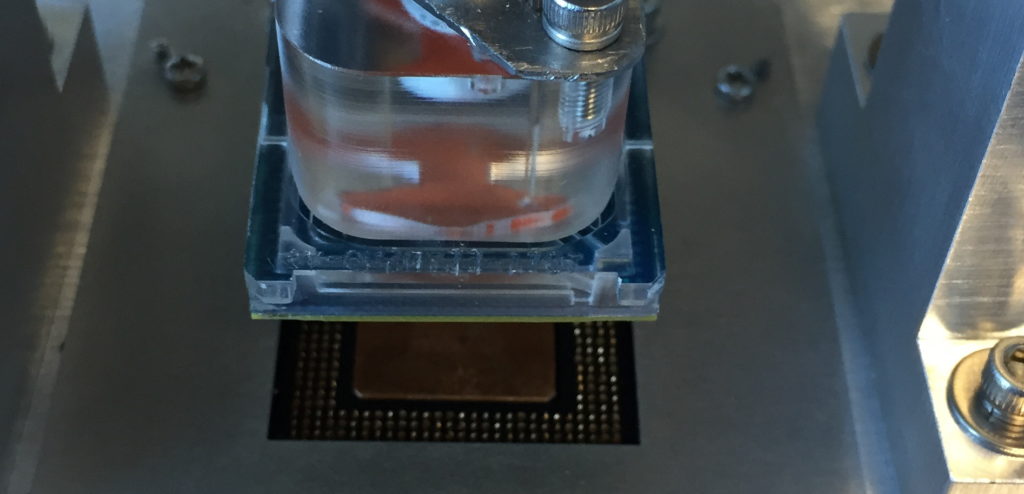
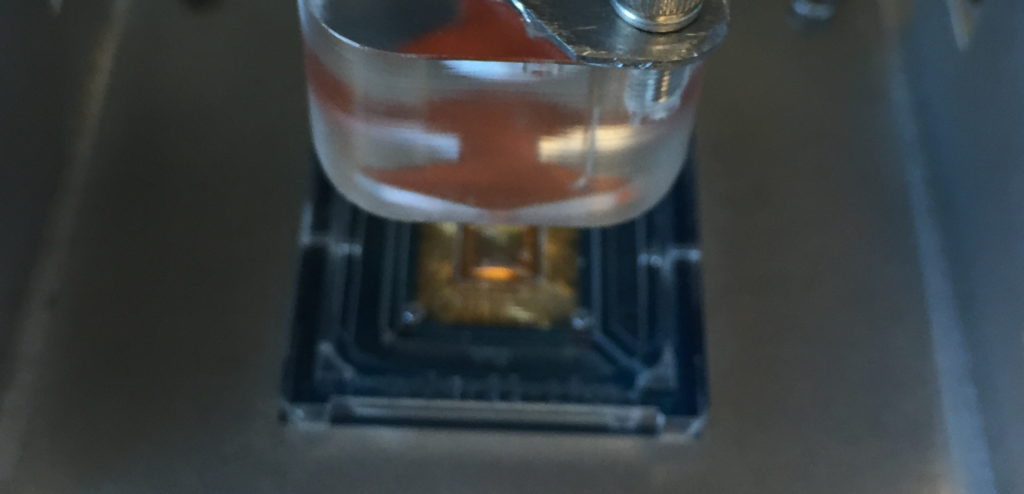
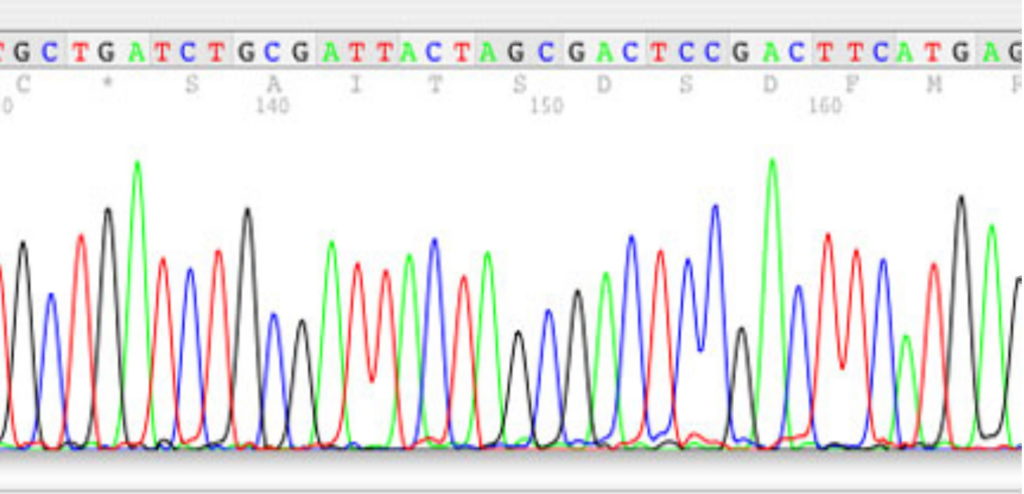
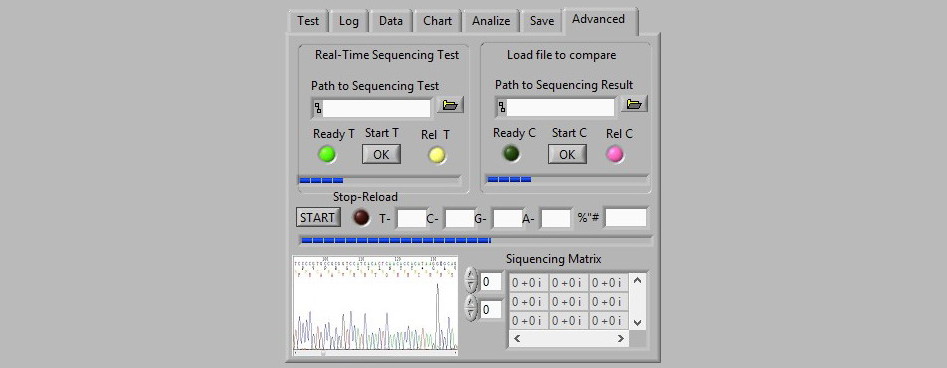
The method of fast impedance spectroscopy of biological objects with high impedance is evaluated. The Rx chip inputs are excited by preformed signal generated by python code on frequency 1MHz, 1000Hz, 100Hz and 1Hz, and influenced to the buffer as an object in the sensor’s area of the chip and response received by U6212 DAQ module. Response signals should to be proportional to current flowing through and voltage across the measured object are sampled. The object’s impedance spectrum is obtained with use of continuous Fourier transformation based on acquired data. The method is evaluated by practical experiment in a measuring of unknown simulation and system on an existed Adapter Board test bench, USB-6212 and USB-6001. During the evaluation the unusual behavior of Tx signals determined that was require the future discovery.
Diagnosis of biological object with use of impedance spectroscopy is still an open research field and it is no determinology exist. This is due to a fact, that there is no universal method capable to diagnose different objects in comparable, short time and also with high accuracy. Higher accuracy of impedance spectroscopy requires more time. Conventional measurement technique used for impedance spectroscopy is based on single sine technique (SST). An object is excited with a harmonic signal and two signals are measured: voltage across and current through the object.
Measurements are repeated for different frequencies in order to obtain impedance spectrum in several decades. For our high impedance objects (Zx > 1 GOHm), this leads to very long measurement times (of an order of hours), because measurements must be performed for very low frequencies (1 uHz, 1 mHz). This kind of diagnosis is acceptable only in condition without photo emission posibility, noise, EMI, vibration (peltier’s fan) and other effects and can not be used directly in the field using our BETA instrument.
In order to shorten time of measurements different methods can be used. One of them is multi-sine technique or other measurement signals. A promising technique depends on usage of a square pulse for excitation of an object and measuring signals proportional to voltage across and current through the object with ADCs. The object impedance spectrum is then obtained with use of continuous Fourier transform on the basis of linear approximations between samples of discrete response signals.
Simulations and experimental research of this method had been performed in Initial Test result Report ABTB, but the method was not evaluated by means of different excitation signals (square, triangle, sawtooth and sinc).
Accuracy of impedance spectrum evaluation or exemplary model of buffer substance in a chip was compared for each excitation using existed Rx signals. Description of proposed method. Different excitation signals (square, triangle, sawtooth and sinc) will be compared in order to estimate accuracy of impedance spectrum evaluation.
In the proposed method a measured object Zx will be excited with an arbitrary waveform Uo(f) and signals proportional to voltage Ux(f) across and current Ix(f) through the object are measured.
The excitation signal generated by DAQ module U6212 with sample rate of 400 kS/s and timing resolution 50 ns. Signal with timing accuracy of 50 ppm of sample rate applied to the object through Aout directly to Rx signal points of the chip. The programmed resistor Rl is used at the output of the amplifier A1 in order to limit the maximum value of current through the object.
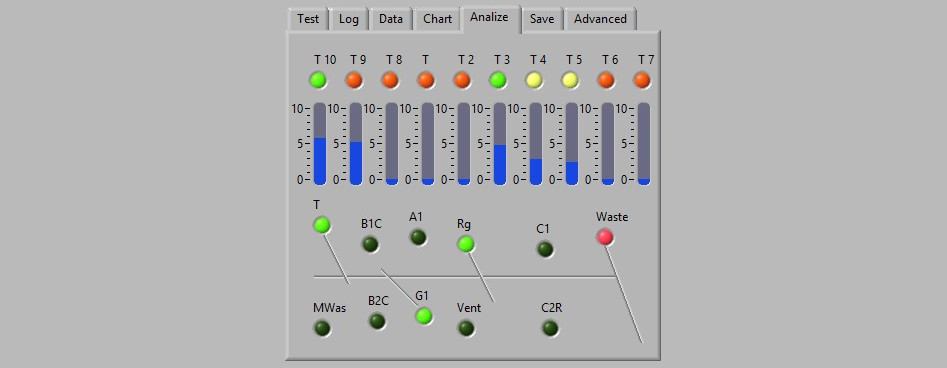
Response signal Ux are converted to signals U1(t) and U2(t) and applied to ADCs in the DAQ module through Ain1 and Ain2. Current Ix(t) is converted to voltage U1(t) by currentto-voltage converter (CVC) realized with amplifier A3. Range of the CVC can be changed with resistor Rr in order to fit the measured signal U1(f) to the range of the ADC.
Test Bench device developed as a sequencing instrument that collected data with implemented method of dielectric spectroscopy also known as impedance spectroscopy, and also known as electrochemical impedance spectroscopy, measures the dielectric properties of a medium as a function of frequency.
It is based on the interaction of an external field with the electric dipole moment of the sample, often expressed by permittivity. In BETA case it is an experimental method of characterizing electrochemical systems.
This technique measures the impedance of a system over a range of frequencies, and therefore the frequency response of the system, including the energy storage and dissipation properties, is revealed.